In today’s fast-paced, data-driven world, businesses and organizations rely heavily on applications to manage processes, track performance, and ensure smooth operations. Whether you’re overseeing user activity, system health, or infrastructure performance, having an efficient way to view and manage all this information is critical. This is where a core app dashboard comes in.
A core app dashboard acts as a centralized visual control center that consolidates key metrics and data into a single, intuitive interface. It provides real-time insights into performance, user behavior, system health, and more, enabling teams to monitor and improve the application’s effectiveness. In this article, we’ll explore the functions, benefits, and tools associated with core app dashboards, and how they contribute to better decision-making and enhanced operational efficiency.
What is a Core App Dashboard?
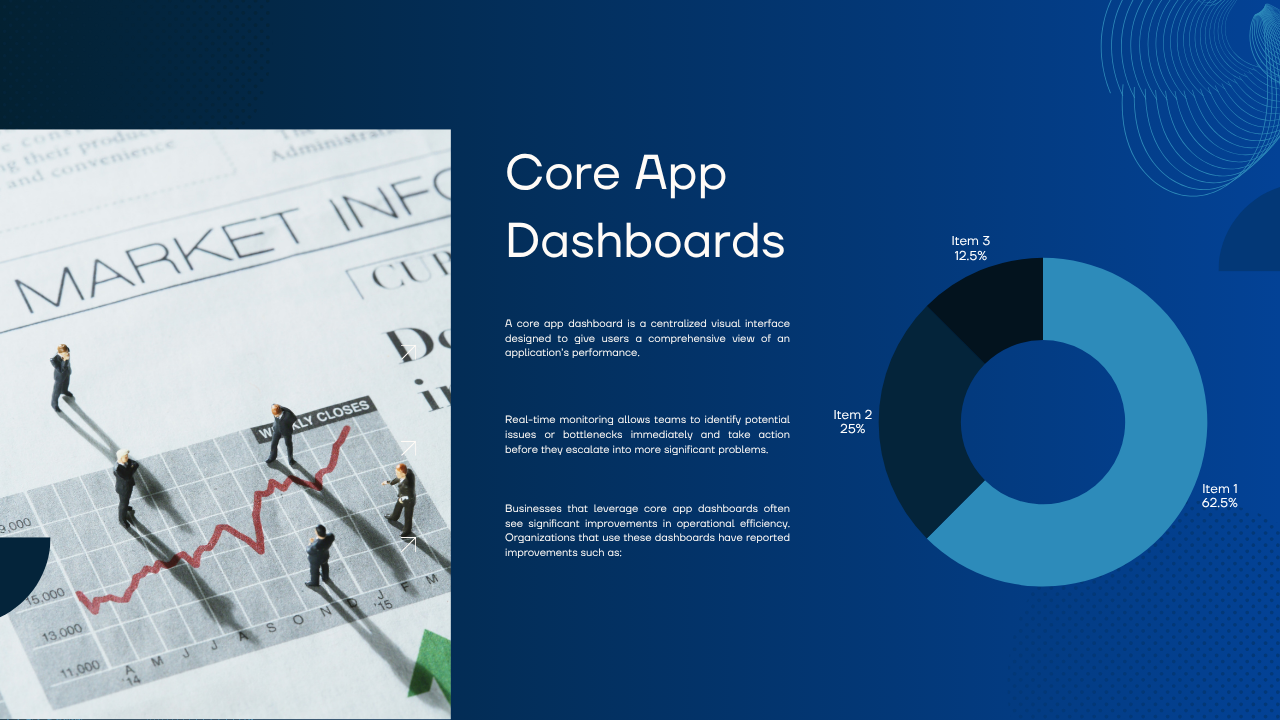
A core app dashboard is a centralized visual interface designed to give users a comprehensive view of an application’s performance. It consolidates various types of data into a unified display, often in the form of charts, graphs, or tables, that allow users to track and assess key performance indicators (KPIs) in real time.
In essence, the dashboard acts as the control center of an application, giving users and teams an instant, at-a-glance overview of the system’s health and performance metrics. This centralized visibility ensures that all team members are on the same page when it comes to monitoring app health, making it easier to spot issues, track improvements, and make informed, data-driven decisions.
Key Functions and Benefits of Core App Dashboards
Centralized Monitoring
One of the core functions of a dashboard is centralized monitoring. This means consolidating data from multiple sources into one visual space, making it easy for teams to access all the important metrics they need in one place. Rather than having to check multiple screens, departments, or reports, users can access an overview of system activity from a unified interface.
For instance, in a complex app with different modules, dashboards can combine performance metrics from various areas, including infrastructure health, user behavior, and server uptime. This streamlined approach saves time and allows for quicker response times in the event of any issues, ultimately improving productivity and security.
Performance Tracking
Performance tracking is at the heart of what makes core app dashboards so valuable. These dashboards track a wide range of real-time signals, including:
- Application health (e.g., uptime, response time, latency)
- User behavior (e.g., engagement metrics, active users)
- Infrastructure performance (e.g., server performance, network bandwidth)
Real-time monitoring allows teams to identify potential issues or bottlenecks immediately and take action before they escalate into more significant problems. Performance data can also serve as the foundation for identifying patterns, understanding user needs, and optimizing resources.
Operational Efficiency
Businesses that leverage core app dashboards often see significant improvements in operational efficiency. Organizations that use these dashboards have reported improvements such as:
- A 60% reduction in MTTR (Mean Time to Resolution): Dashboards enable teams to quickly identify and respond to issues, decreasing the time spent on resolving problems.
- 25% cost savings: By having centralized access to key performance metrics, businesses can optimize resources more effectively, reducing unnecessary costs.
Dashboards help reduce the time spent gathering data or manually creating reports, which ultimately frees up valuable time for employees to focus on solving problems and improving operations. Additionally, data-driven decision-making becomes easier, as decision-makers can quickly access the metrics that matter most.
Workflow Automation
Some core app dashboards take it a step further by integrating automation features. For example, platforms can leverage AI chatbots or automated alerts to notify teams of critical issues or even suggest possible solutions before the user notices the problem.
These features are particularly useful in scenarios where quick responses are necessary. If a system goes down, for instance, an automated alert can trigger predefined actions such as notifying the IT team or starting up backup processes. The integration of workflow automation with real-time monitoring makes proactive problem-solving possible, leading to better application health and improved service delivery.
Popular Tools for Building Core App Dashboards
Building a custom core app dashboard doesn’t have to be complex. Several tools and platforms allow teams to create dashboards tailored to their specific needs. Some of the best-known tools include:
1. Metabase
Metabase is a popular open-source tool that allows teams to build self-hosted dashboards and reports. It is particularly effective for teams with SQL access, as it enables users to write custom queries to extract the necessary data. Metabase offers a clean, intuitive interface for visualizing complex data and is suitable for businesses looking for a flexible, cost-effective solution.
Best For: Teams with strong SQL capabilities and a need for self-hosted dashboards.
2. Grafana
Grafana is a powerful open-source analytics and monitoring platform widely used for DevOps and IT monitoring. It specializes in displaying technical metrics and data from various sources, making it a favorite for teams who require deep system insights. Grafana can handle large volumes of real-time data, which makes it ideal for businesses running complex cloud-based infrastructure.
Best For: DevOps teams, IT infrastructure monitoring, and businesses that need advanced technical insights.
3. Microsoft Power BI
Power BI is a popular business intelligence tool used for creating interactive reports and dashboards. It integrates seamlessly with the Microsoft 365 ecosystem, making it a great choice for organizations already using Microsoft tools. Power BI allows users to create dashboards with easy-to-use drag-and-drop features and offers real-time data analysis, helping decision-makers visualize data for more informed actions.
Best For: Microsoft 365 users looking for business intelligence capabilities and an easy-to-use interface.
4. DrapCode
DrapCode is a low-code platform that streamlines the dashboard creation process. It’s particularly useful for teams looking to manage data flows efficiently without deep coding knowledge. DrapCode allows users to build powerful dashboards and integrate them with their apps quickly. This tool helps reduce development time and makes the process of designing a dashboard more intuitive.
Best For: Teams looking for a low-code solution to build custom dashboards and streamline development.
5. Plasmic
Plasmic is a no-code platform for building visually appealing dashboards and interfaces. It allows users to create rich, interactive dashboards without the need for technical knowledge. Plasmic integrates deeply with core applications, offering seamless transitions between design and functionality. This tool is ideal for businesses that want aesthetically pleasing dashboards alongside functional data management.
Best For: Non-technical teams who need to build visually rich dashboards integrated with core apps.
6. FineBI
FineBI is an advanced business intelligence tool designed to help teams track KPIs and analyze big data efficiently. FineBI focuses on connecting and analyzing large datasets, offering a powerful solution for businesses that need to track performance metrics across various departments. It’s a great tool for enterprises with complex data needs.
Best For: Enterprises with large datasets and a need for advanced data analysis and KPI tracking.
Conclusion: The Value of Core App Dashboards
Core app dashboards have become an essential tool for businesses of all sizes, offering real-time insights, operational efficiency, and better decision-making. By consolidating complex data into intuitive interfaces, these dashboards help teams monitor performance, track key metrics, and respond to issues quickly, ultimately improving the overall health of applications and systems.
With the rise of powerful tools such as Grafana, Metabase, and Microsoft Power BI, building and customizing dashboards has never been easier. Whether your team needs to monitor IT infrastructure, track business performance, or visualize complex data, there is a solution available to help streamline the process.
As businesses continue to embrace the power of data-driven decision-making and workflow automation, core app dashboards will undoubtedly play a crucial role in helping organizations stay competitive, efficient, and proactive in their operations.
FAQs About Core App Dashboards
What is the purpose of a core app dashboard?
A core app dashboard serves as a centralized control center that provides real-time visibility into performance metrics, user activity, and critical system signals. It helps teams monitor application health, track key metrics, and make informed decisions based on data.
What are the key functions of a core app dashboard?
Core app dashboards consolidate essential data, track performance signals, improve operational efficiency, and provide real-time insights. Some dashboards also integrate workflow automation and AI-driven alerts to proactively address issues.
What tools are available for building core app dashboards?
Popular tools include Metabase (SQL-based dashboards), Grafana (for DevOps and IT monitoring), Microsoft Power BI (for business intelligence), DrapCode (for low-code development), Plasmic (for no-code design), and FineBI (for data analysis and KPI tracking).
How can a core app dashboard improve operational efficiency?
By centralizing data and tracking key metrics in real-time, core app dashboards help reduce response times to issues, lower operational costs, and improve resource management. This leads to more efficient decision-making and problem resolution.
Can core app dashboards be customized?
Yes, many dashboard tools allow for customization, so businesses can tailor the visual layout, data sources, and functionality to meet their specific needs. Some platforms offer low-code or no-code features to simplify the customization process.


